Fundamental Analysis: Finding the “Value” of Stocks

Fundamental Analysis: Finding the “Value” of Stocks
Fundamental analysis is a method used by investors to evaluate the financial health and intrinsic value of a company, aiming to make informed decisions about whether to invest in its stocks or not. This approach considers various factors, such as the overall state of the economy, industry trends, and a company's specific financial statements and management performance.
By analyzing these elements, investors can determine if a stock is undervalued or overvalued and make investment decisions accordingly.
One of the key features of fundamental analysis is its focus on both qualitative and quantitative aspects. Qualitative factors involve assessing aspects such as a company's brand reputation, competitive advantage, and management team effectiveness. Comparatively, quantitative factors are those that can be measured numerically through financial statements – including income statement, balance sheet, and cash flow statement.
Among the numerous fundamental analysis tools available for investors' use are various financial ratios that aid in evaluating different aspects of a company's performance. Some commonly used ratios include price-to-earnings (P/E) ratio, debt-to-equity (D/E) ratio, return on equity (ROE), and operating margin.
The P/E ratio compares a company's stock price to its earnings per share (EPS). It measures how much investors are willing to pay for each dollar of earnings generated by the company. A high P/E ratio may indicate that the market has high expectations for future growth; however, it could also suggest that the stock is overpriced.

The D/E ratio measures a company's total debt relative to its shareholders' equity. It helps investors assess how leveraged a company is and how effectively it uses debt financing for business expansion. Generally speaking, lower D/E ratios indicate more financially stable companies with lower risk profiles due to their ability to meet their debt obligations comfortably.
One of the main objectives of fundamental analysis is to identify potential investment opportunities by evaluating whether a stock is underpriced or overpriced relative to its intrinsic value. If the analysis suggests that a stock is undervalued, it may present an attractive opportunity for investors to buy before its price rises. Conversely, if a stock appears overvalued, investors may decide to sell and realize profits before the market corrects itself.
There are two primary types of fundamental analysis: top-down and bottom-up approaches. Top-down analysts begin by examining macroeconomic factors such as interest rates, inflation, and global economic trends before drilling down into specific industries and individual companies. On the other hand, bottom-up analysts focus first on individual companies' financial health and management performance before considering wider industry trends and macroeconomic factors.
For many investors, fundamental analysis is an essential tool for making well-informed investment decisions in stocks.
By considering various qualitative and quantitative factors alongside financial metrics like P/E ratio and D/E ratio, investors can gain insights into a company's true worth – ultimately optimizing their investment strategies for success in the long run.
What is fundamental analysis in the stock market?
This form of financial examination is a method investors and finance professionals utilize to assess the intrinsic value of a stock or security, which can help determine whether it's a worthy investment.
By evaluating various aspects of the company behind the security, an investor can form an opinion on its financial health and future prospects. As such, fundamental analysis serves as a cornerstone for making informed investment decisions, with broad applications ranging from individual stocks to entire industries.
There are several components of fundamental analysis that come into play when evaluating a stock. One critical aspect is an examination of the company's financial statements – including balance sheets, income statements, and cash flow statements – which provide insights into its profitability, liquidity, operational efficiency, and overall stability.
Moreover, this analysis often involves assessing key financial ratios and metrics like price-to-earnings (P/E) ratio, debt-to-equity (D/E) ratio, return on equity (ROE), and dividend yield to facilitate comparisons between different companies within the same industry.
Another crucial element in conducting fundamental analysis is understanding the qualitative factors impacting a company's performance. These factors encompass elements such as management competency and corporate governance structure, brand reputation, competitive advantages (e.g., proprietary technology or patents), industry position and potential market share growth opportunities, as well as larger economic trends that may affect businesses within certain sectors.
A practical example of fundamental analysis at work could involve examining a well-known technology company's most recent quarterly earnings report. An investor may scrutinize revenue growth figures and profit margins to determine if they're trending upwards year-over-year or remaining stagnant; they might also evaluate the company's R&D investments relative to competitors within the same sector in order to gauge its commitment to innovation.
To refine their skills in performing comprehensive fundamental analyses on stocks and securities or learn about more advanced concepts beyond these basics mentioned above – such as discounted cash flow models or enterprise value calculations – investors may turn to a wealth of resources like books, online courses, and financial news articles.
There are countless fundamental analysis of stocks books available, ranging from introductory texts for beginners to more advanced titles geared towards seasoned investors.
Wall Street analysts also rely heavily on fundamental analysis in order to spot potentially lucrative investments for their clients, as they utilize these techniques to evaluate securities based on objective data points and ascertain whether or not they're undervalued or overvalued in the current market.
By doing so, these professionals can provide well-researched recommendations rooted in strong financial foundations and sound investment principles.
As is often necessary in the world of trading, fundamental analysis offers a systematic approach for appraising the intrinsic value of stocks by examining various quantitative and qualitative factors. It is an indispensable tool for making informed investment decisions that can help individual investors and finance professionals alike navigate the complex landscape of the stock market with greater confidence and precision.
Example of Fundamental Analysis
Fundamental analysis is a widely utilized method in the world of finance, particularly when it comes to understanding and evaluating stocks. In essence, fundamental analysis delves into the core factors that influence an organization's financial performance, such as revenues, expenses, assets, liabilities, and other related aspects. By scrutinizing these elements, investors can make informed decisions about a company's worth and whether or not its stocks are accurately priced.
Economic analysis in fundamental analysis is yet another crucial component that helps examine the macroeconomic environment wherein a business operates. This evaluation may include factors like GDP growth rates, inflation trends, employment rates, interest rate fluctuations, fiscal policies from governments, and many others. All of these considerations contribute to painting a broader picture of an organization's stability and potential for growth.
To illustrate an example of fundamental analysis more tangibly, let's consider Apple Inc., which happens to be one of the largest technology stocks and the most valuable company on the planet. Suppose Apple recently reported its earnings for the latest quarter. In that case, investors could delve into various financial metrics to decide if its current stock price is fair or under/overvalued based on their assessment.
Firstly, investors may look at key ratios such as Price-to-Earnings (P/E), Price-to-Sales (P/S), and Price-to-Book (P/B) ratios to gain insight into how the market values Apple compared to its competitors. A lower P/E ratio could indicate that Apple's shares are undervalued relative to its earnings potential.
Additionally, analyzing the company's balance sheet would provide insights into its financial health by evaluating assets versus liabilities. A strong balance sheet with low debt levels suggests robust solvency while also highlighting potential investment opportunities due to greater financial flexibility.
The importance of fundamental analysis in examining dividend payout ratios should not be understated either – especially for income-driven investors seeking steady cash flow streams from their investments. Investors need to ensure that companies have healthy dividend payout ratios indicating that the company's earnings are more than sufficient to cover its dividend payments, reducing the risk of future dividend cuts or suspensions.
Scrutinizing Apple's income statement would help determine whether the company is on an upward trajectory in terms of profitability and revenue growth. Positive trends would signal a potential opportunity for investment, as it may indicate that the organization continuously capitalizes on market opportunities to maximize returns.
Lastly, an investor may also look at their past earnings reports to analyze these financial metrics, such as have they increased or decreased? Is that good or bad? This the more of the qualitative aspect to fundamental analysis, the qualitative would be listening closely to the company’s outlook. Would they estimate that is going to be pessimistic or optimistic based on such things like those macroeconomic factors we described above.
With fundamental analysis, the ability to prequalify stocks serves as an essential guide for investors to make informed decisions about investing in a company like Apple. By meticulously evaluating financial ratios and metrics, economic environments, and industry-specific factors, investors can ascertain a stock's intrinsic value and decide at what price point they are comfortable investing. This diligent approach helps mitigate risks while maximizing return potentials in the ever-evolving world of finance and investments.
Fundamental Analysis vs. Technical Analysis
Fundamental analysis and technical analysis are two primary methods used by market participants to examine a position by an investor or stock trader. In the case of technical analysis, this is primarily the choice of trades, short-term buyers and sellers of option contracts on a particular stock or ETF.
Conversely, for the approach of the long-term investor, fundamental analysis is often the weapon of choice. This way, investors can have more confidence in one long-term position, as opposed to another.
These analytical approaches differ significantly in their approach, data sources, and goals. This article will introduce the reader to both fundamental analysis and technical analysis, comparing and contrasting their differences, and exploring how each can be applied in determining which stocks to purchase.
Technical analysis is a method that involves studying past market data, such as price movements and trading volume. It employs mathematical tools like charts and indicators to aid traders in identifying patterns that may suggest future market trends or potential investment opportunities.
Technical analysts believe that historical price action can provide valuable insights into the future direction of stock prices. In short, they operate under the assumption that history tends to repeat itself over time.
Whereas fundamental analysis seeks to determine a company's intrinsic value by examining its financial statements, including balance sheets, income statements as well as other economic factors like industry conditions, competitor performance, management quality, etc.
Fundamental analysts believe that this type of information helps them predict a company's prospects for long-term growth or decline more accurately than merely looking at stock price movements alone.
One key difference between these two methods lies in their respective focuses on qualitative vs. quantitative factors. For example, economic analysis in fundamental analysis delves deep into macroeconomic indicators such as GDP growth rates or interest rate fluctuations affecting an economy at large – which could ultimately have an impact on a specific company's bottom line. In contrast, technical analysts focus on chart patterns and statistical indicators derived from price movement data alone – often ignoring broader market events entirely.
Another essential distinction between fundamental analysis and technical analysis is the time horizon each approach targets. Typically speaking, fundamental analysts tend to have longer-term investment horizons because they aim to uncover the true value of a company over an extended period; whereas technical analysts might engage in shorter-term trading strategies based on quick entry-and-exit points gleaned from chart patterns and trends.
To illustrate a fundamental analysis example, an investor may assess the balance sheet of a company to determine its overall financial health. They may also examine factors such as sales growth and profit margins, comparing these metrics to competitors in the same industry to gauge the company's performance relative to its peers. This comprehensive approach enables investors to have a deeper understanding of a stock's long-term potential for appreciation or depreciation.
Ultimately, both fundamental analysis and technical analysis offer unique perspectives into the evaluation of stocks. While fundamental analysis is more focused on understanding a company's intrinsic value through economic indicators and financial statements, technical analysis relies on past price movements and mathematical tools to predict future market trends. Investors may choose one approach over another based on their individual preferences, management of risk, and investment goals; however, combining aspects of both methods can provide a more balanced perspective when making decisions about which stocks to buy.
How Can Magnifi Help Your Fundamental Analysis?
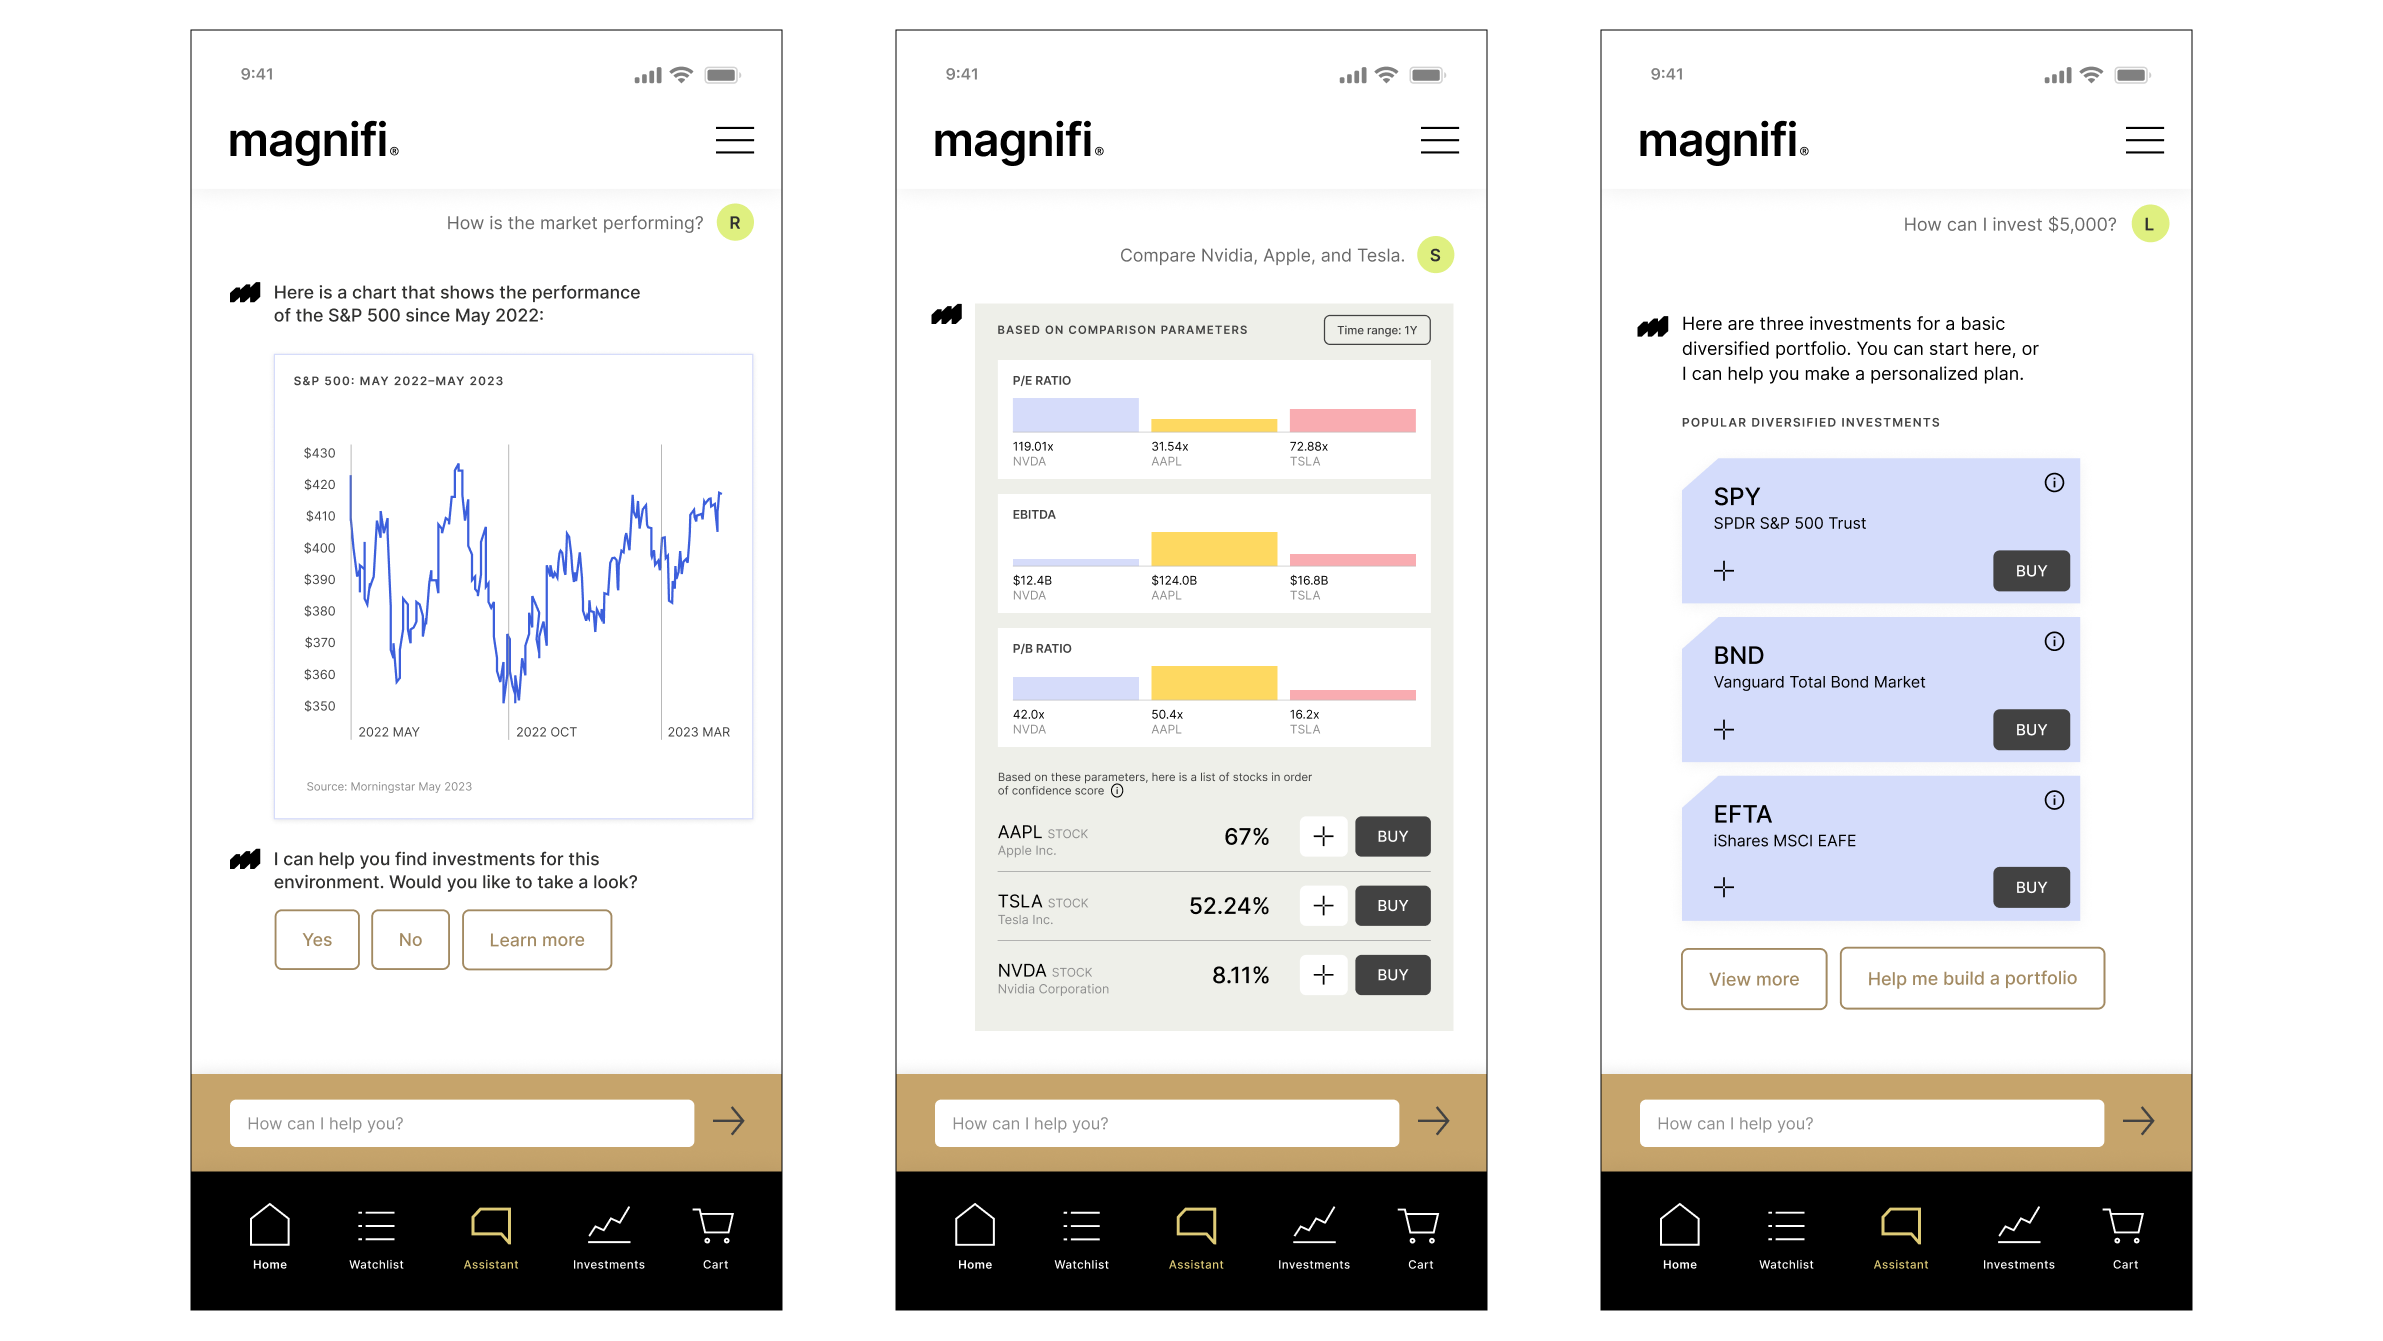
No longer will you have unanswered questions like, "what is the P/E ratio of AAPL?" With your all new AI investing assistant, Magnifi, you will now get up-to-date answers to questions such as this one. Find out all the key financial metrics you'll need to practice your hand at fundamental analysis of stocks in the market. Once you find a stock with metrics that meet your investment plan, simply buy the stocks right on the app.
Invest with the confidence you're getting all the guidance and up-to-date information you'll need to make your next big investment decision.
Try Magnifi Today
Ready to start investing? Click here to meet Magnifi today.
Disclosures:
Magnifi is changing the way we shop for investments, with the world’s first semantic search engine for finance that helps users discover, compare, and buy investment products such as ETFs, mutual funds, and stocks. Open a Magnifi investment account today.
The information and data are as of August 24, 2023, unless otherwise noted and subject to change. This blog is sponsored by Magnifi.
This material is provided for informational purposes only and should not be construed as individualized investment advice or an offer or solicitation to buy or sell securities tailored to your needs. This information covers investment and market activity, industry, or sector trends, or other broad-based economic or market conditions and should not be construed as investment research or advice. Investors are urged to consult with their financial advisors before buying or selling any securities. Although certain information has been obtained from sources believed to be reliable, we do not guarantee its accuracy, completeness, or fairness. Past performance is no guarantee of future results. This content may not be reproduced or distributed to any person in whole or in part without the prior written consent of Magnifi. As a technology company, Magnifi provides access to tools and will be compensated for providing such access. Magnifi does not provide broker-dealer or custodial services.
Exchange Traded Funds (ETF’s) are sold by prospectus. Please consider the investment objectives, risks, charges, and expenses carefully before investing. The prospectus, which contains this and other information about the investment company, can be obtained from the Fund Company or your financial professional. Be sure to read the prospectus carefully before deciding whether to invest.
Diversification does not guarantee a profit or protect against a loss in a declining market. It is a method used to help manage investment risk.